Feb 07, 2020 by [ "James R. Miller"
]
Categories:
trading
Tags:
mnq
futures
Reading market congestion
One of the ways I like to trade is by figuring out whether the big traders are accumulating long positions or short positions. Once they show their hand, I like to then enter alongside the big traders. I like to think of each trade like throwing a leaf into river rapids. The wind might blow my leaf around, but if I can land it on the river, it’s going to mostly follow the currents.
Chart Particulars
This is a chart of the e-micro nasdaq futures contract March expiration on February 7, 2020. (MNQH0 or MNQH20 depending on your broker). You can click on the image for a higher resolution image. The time range is Texas time, so the New York open is 8:30am on the chart. The candles are 1-minute candles.
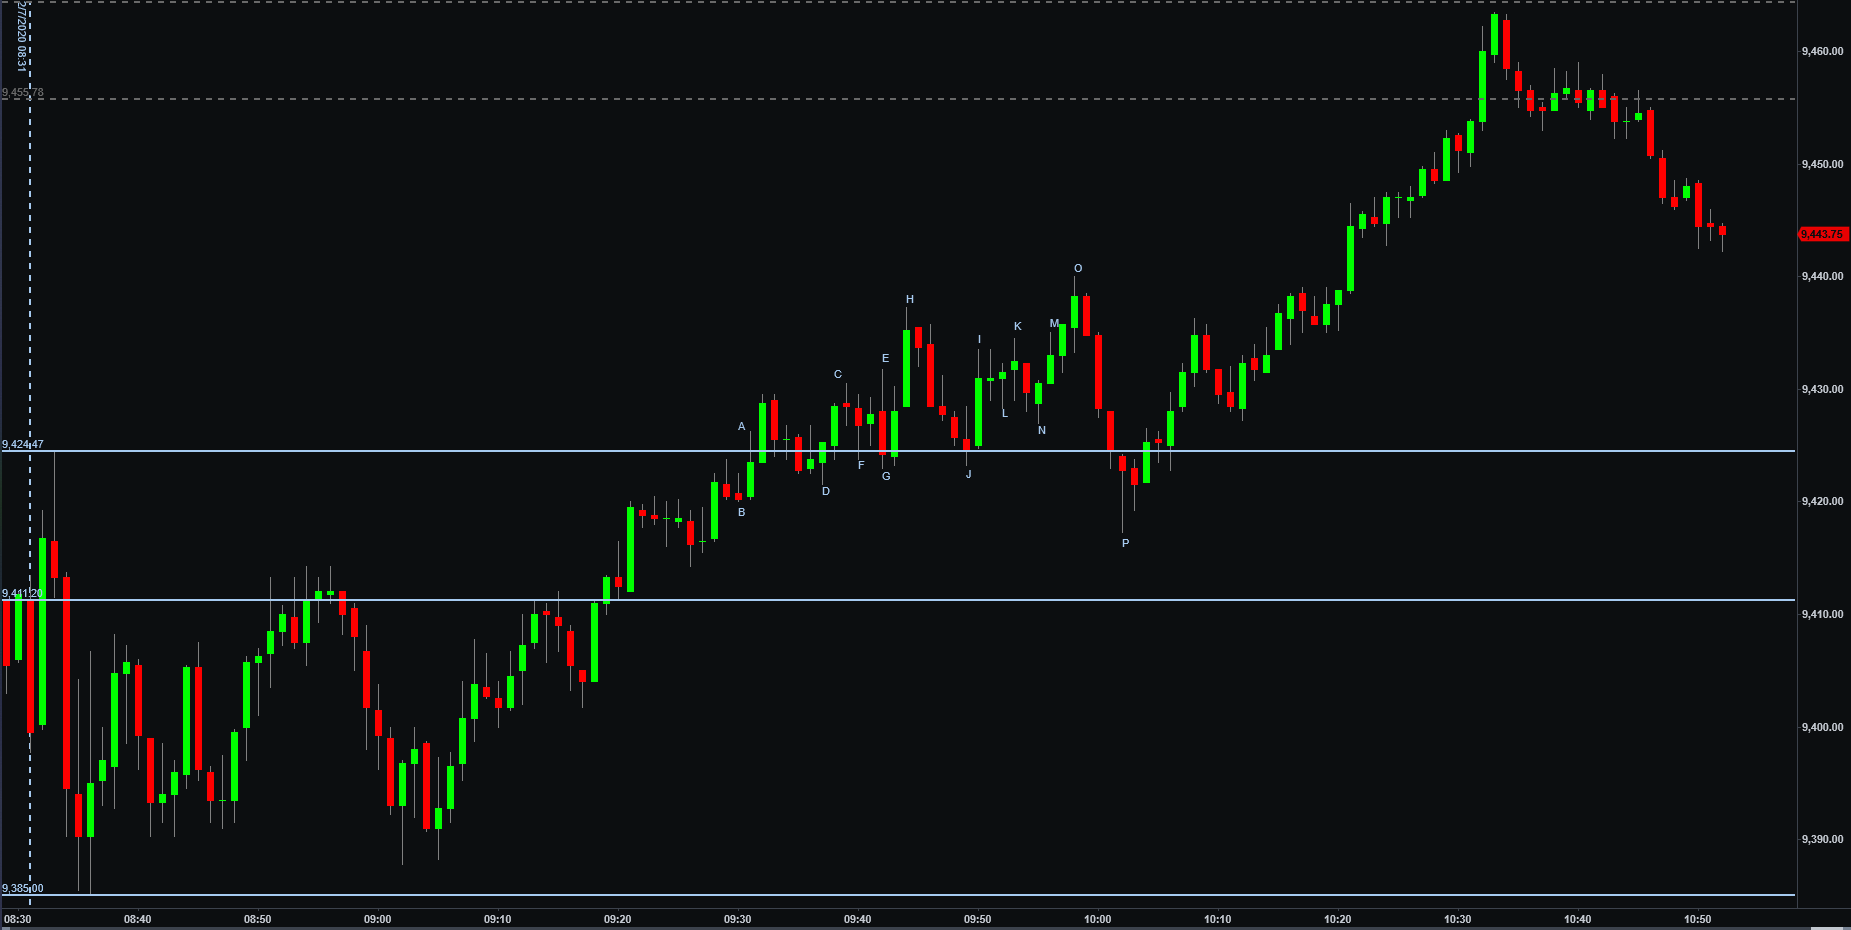
The three white lines are:
- The top is the top of the opening range put in during the non-farm payroll news release at the open.
- The middle is the opening price.
- The bottom is the bottom of the opening range.
The dotted lines are prior history support and resistance, basically just drawing a horizontal line from prior long wicks/tails.
Market summary
The market put in a fairly big head fake in the first few minutes of the day, snapping up and down. Price tested the open and it served as resistance between 8:50 and 9:00 and again around 9:15. After the resistance broke near 9:20, I was looking at a possible long as a break of the opening range.
When we hit a congestion area around support/resistance, I start looking at low timeframe charts to see if I can figure out if the large traders are doing more buying or selling. Since they are dealing with hundreds or thousands of contracts, it’s not as simple for them to enter a position with a simple click of the mouse. They have to scale in and out of positions. If we can spot which way they’re scaling in, we can profit from that knowledge.
What if you were big enough to move the market?
For the sake of the chart, and because we know being long was the correct direction, if you were tasked with entering a thousand-contract orders to go long around 9,424.50, how would you do it?
Well, at A, you’d buy a chunk, just enough to make the price tick over the opening range. Break-out traders would place entries here, and then many of them will place stop-loss orders, likely near B.
The large trader would then stop buying, and let the market float down to a more favorable price, and then that trader would start buying again, driving the price up again towards C. New breakout traders would see the break of the highs put in near A and go long at C, likely putting stops near D.
This pattern continues with the price float down, then ticking back up just enough to tempt the break-out traders to enter. Occasionally, a large amount of break-out traders jump in like in H; but, once again, we’re either seeing the large traders either (a) simply stop buying, or (b) they sold a small portion of their positions to keep the market in the range.
Look at the (false) break-out at E and the snap back to G. The big traders just created a pile of willing sellers at F. By letting the market fall to G, the big traders were able to be the buyer for all of the E breakout stop loss orders. Do you see how the K breakout leads to stop losses placed at L, and then N gobbles up those pending sale orders?
The most interesting move
The most interesting move is P, and is the basis for many reversal patterns you’ll see. P is the move that lets us know it’s time to get in or to be ready for some directional movement. The big traders have been manipulating the orders for the last half hour, strategically “creating” willing sellers at discount prices. These orders are placed anywhere in the range created by N through B. The large trader will sell a chunk of their positions at O with the idea to take price all the way below B. Once they get into those orders, they stop selling and again start buying, but buying as much as they can.
Here’s the other thing, that hammer-bar at P will not only trigger stop-loss orders from the prior break-out trades; it will also look like a strong momentum short bar; meaning, many of those break-out traders that are taking a loss here, will then reverse their positions to chase the market as it (temporarily) appears to be going short. That is, until the large traders come in buying in full force.
Ironically, those traders that took the breakout to the short side at P are just helping the buying pressure as their buy-to-cover stop losses just play even more into the large traders’ plans.
Price then takes off to the long side, and doesn’t look back other than some natural pauses (that’s the large traders reducing their gigantic positions and booking some profit).
Conclusion
Ever been trading and you feel like nothing makes sense? Or that the market whips you around and steals your money? It’s intentional and you have to figure out how to (a) avoid getting caught in the manipulation or (b) learn to trade the manipulation without getting stuck in the resulting directional move.
Pull up some congestion zones on your charts; see if you can spot the signs of the large traders. Try and mentally or actually draw where you think the stop losses placed in the current congestion are congregating. And then, when you see a whip move “gobble” up those stop losses, start looking for entries in the direction opposite of the whip move.